

In this edition of “SONAR Indices & Insights,” the SONAR team explains another index found within SONAR, the freight forecasting platform from FreightWaves. This week, learn how freight market participants are predicting the impacts that containerized freight volumes may have on inland freight moves out of major U.S. port cities. With these SONAR indices, users can see higher or lower activity of containers coming into ports (imports) and out of ports (exports). In this article, you learn what the Loaded TEUs indices are, what the Loaded TEUs indices monitor, and what the Loaded TEUs indices indicate to various freight market participants about the potential impact on freight costs and available trucking capacity for inland freight networks.
There are four available Loaded TEUs indices that monitor both import and export containerized freight volumes in addition to both total and differential indices. The Loaded TEUs indices are as follows:
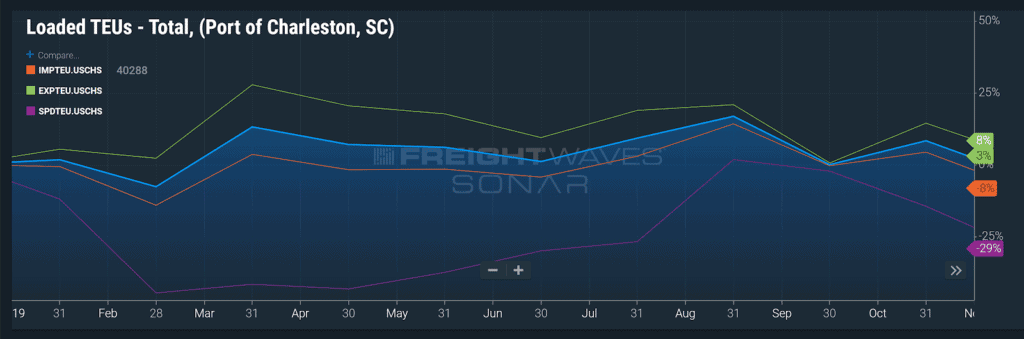
The SONAR chart above shows all of the containerized freight TEU volumes using all four of the Loaded TEUs indices monitoring volumes at the Port of Charleston, South Carolina.
Freight market participants who have freight moves in and around major U.S. port markets would have a keen interest in the Loaded TEUs indices, especially the IMPTEUs. A surge in imports to that market may mean inland freight networks may have higher spot freight rates with trucking carriers or on intermodal moves, as well as an impact on available capacity, indicating that shippers, brokers, and carriers may have to adjust their plans in kind.
The following freight market participants are using FreightWaves SONAR’s Loaded TEUs indices that monitor containerized freight volumes:
Freight market participants will also have various indications depending on which of the containerized freight volumes indices they apply:
Loaded import TEU containerized freight volumes at major US ports are very good indicators of freight volumes moving into port cities. Since a lot of freight originates overseas and then disseminates into transportation networks across the US, these loaded TEU volumes can help predict trends in freight volumes across the United States. For instance, if loaded TEU volumes are increasing month-over-month, then it is highly likely that truckload, LTL, and intermodal freight volumes will increase as well.
Loaded export TEU volumes at major U.S. ports are very good indicators of freight volumes moving out of port cities. Loaded Export TEU volumes can a leading indicator of how U.S. exports are trending or performing in the global economy. For instance, if loaded TEU containerized freight volumes are increasing month-over-month, then it is highly likely that U.S. exporters are finding increased demand for U.S.-made goods abroad. Generally, when the U.S. dollar has a lower value relative to other world currencies, then exports will likely increase and this is a great indicator to keep track of that shift. Conversely, if the dollar is strong and has a higher value, exports will normally drop as these U.S. goods become more expensive.
Loaded TEU volumes at major U.S. ports are very good indicators of freight volumes moving into, and out of, port cities. Looking at total TEU volumes for both imports and exports can assist in identifying ports that are responsible for a large portion of U.S. freight movements in and out of the country. Since around 90% of global trade occurs via maritime shipping, loaded TEU volumes can also assist in understanding the overall health of U.S. trade in the global economy. If total loaded TEU volumes are increasing m/m, then one can assume that U.S. trade with other countries is also increasing. Conversely, If loaded TEU containerized freight volumes are declining m/m, then one can assume that U.S. trade with other countries is also in decline.
moving into, and out of, port cities. Looking at the spread (difference) between loaded import and export TEU volumes can assist in identifying the trade imbalance at a given U.S. port. If a port handles more loaded import TEU volumes than loaded export TEU volumes, then one can assume that the port serves as a major destination for U.S. imports, rather than a major origin port for U.S. exporters. The loaded TEU spread can also assist in understanding the overall health of U.S. trade in imports and exports in the global economy. If loaded TEU import volumes are increasing, and the loaded TEU spread is also increasing, then that means that loaded exports at that port are either decreasing or staying the same. Conversely, if loaded TEU import volumes are decreasing, and the loaded TEU spread is also decreasing, then one can assume that loaded export volumes are either increasing or staying the same.
In turbulent times, freight market participants need certainty to stay ahead of the freight market and understand the freight demand occurring in each participant’s most important lanes, markets and shipping modes. The premier freight forecasting engine, FreightWaves SONAR, allows participants to benchmark, analyze, monitor and forecast freight demand and costs in addition to the impact on the inland freight network or get a pulse of overall economic health seen in containerized freight volumes within the Loaded TEUs indices.
SONAR ensures more proactive responses to the market, provides correlations between several indices to guide decisions and helps to manage freight budgets or margins more proactively. Click the button below to get a demo of SONAR to see what the platform can do for you.


