
Truckload spot rates have dropped 37% since their peak value achieved in January, according to SONAR’s National Truckload Index, Linehaul Only (NTIL).
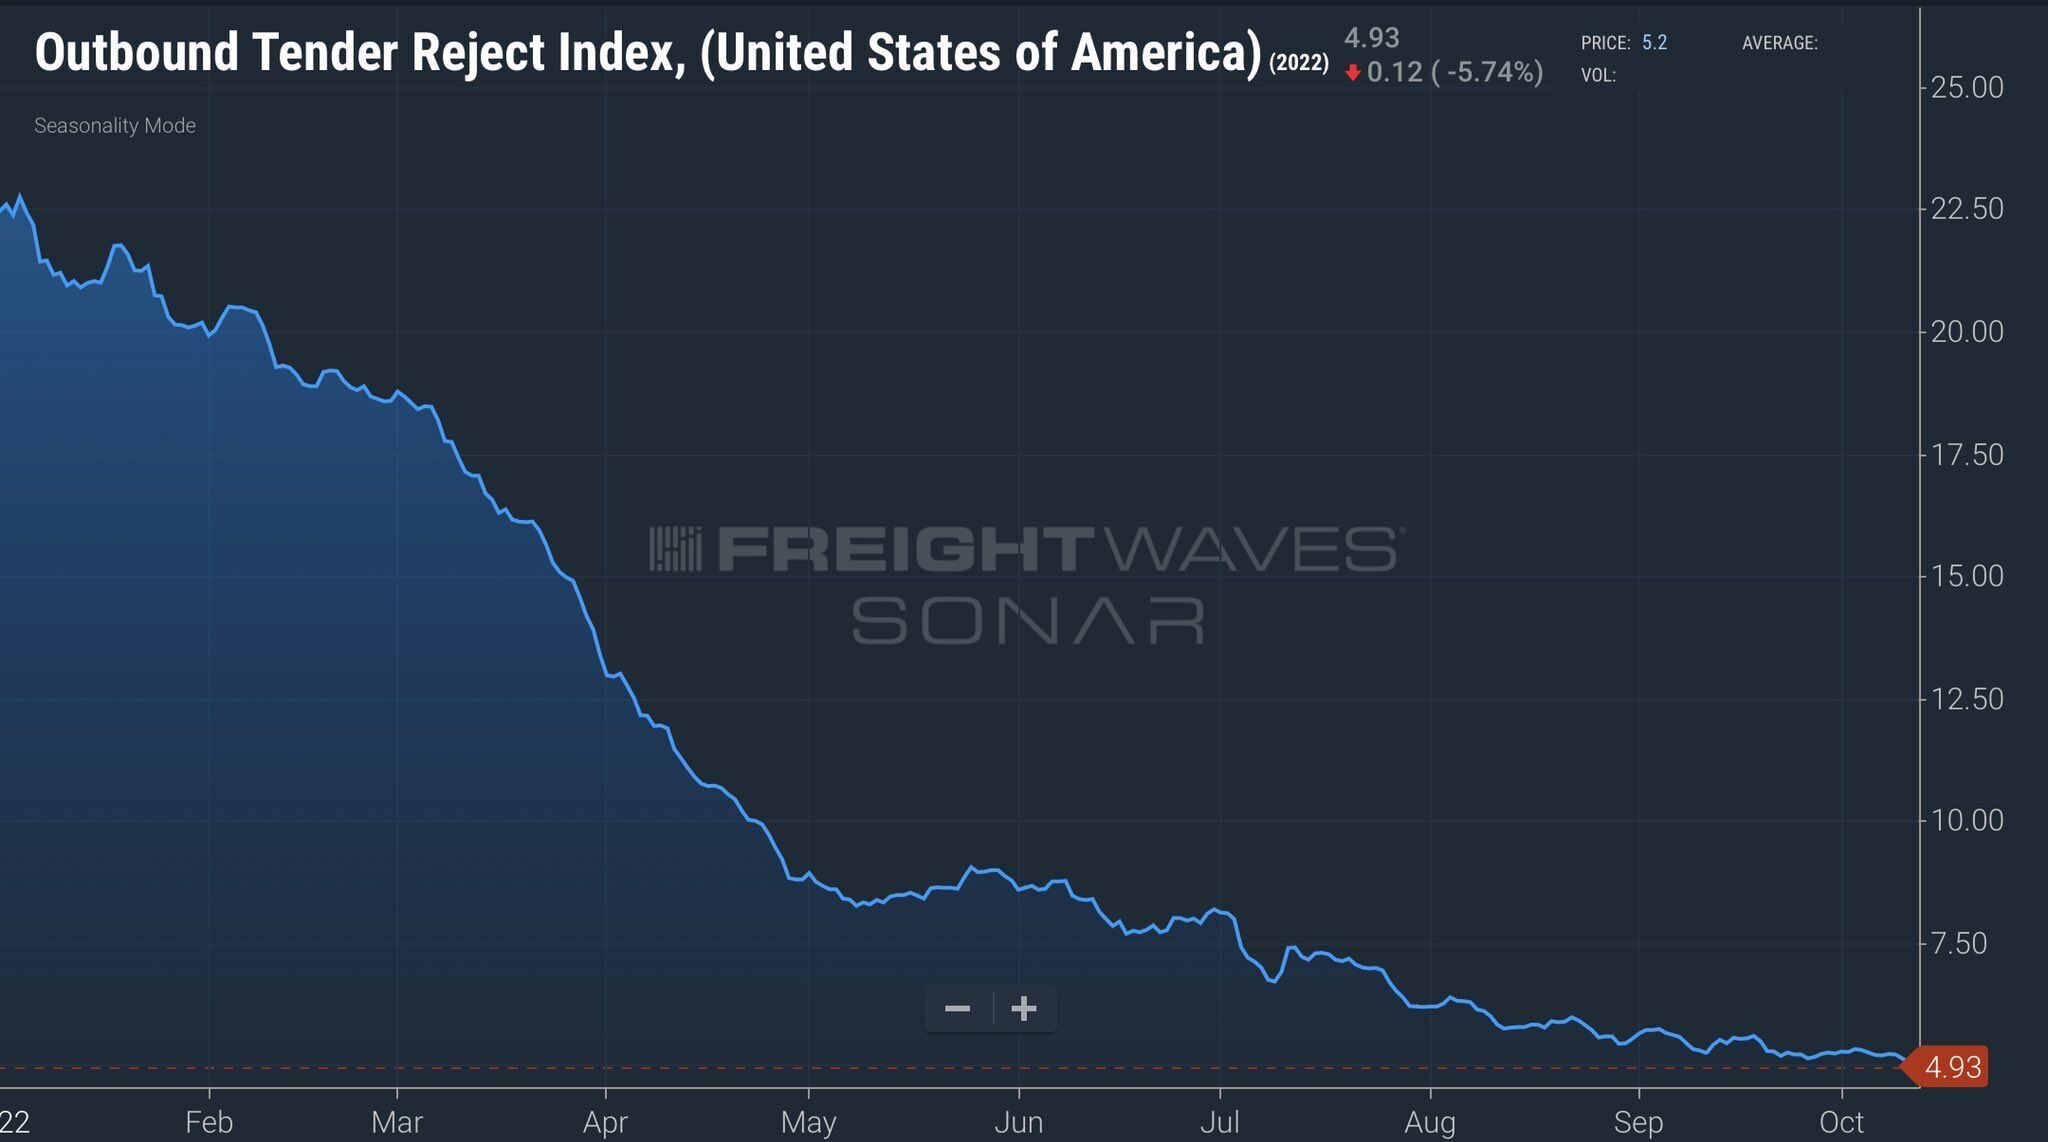
Last week, tender rejections fell below the 5% mark to 4.93%, a new cycle low last seen in May 2020 when the economy was shifting out of the lockdown-induced deep freeze. With the bottom around 4%, there’s not a lot further to fall.
Tender rejections measure the percentage of contracted loads that were “rejected” or turned down by trucking companies because they have better options in the spot market.
Consequently, trucking companies will aim to keep trucks moving and inherently overcommit to contracted freight due to the inconsistency of freight demand. The cost of not having a load is far greater than the penalty for rejecting it.
In favorable conditions, trucking companies are offered more contract loads than they have trucks and have the luxury of being selective. In adverse conditions, there are fewer options, which forces trucking companies or owner-operators to take almost any contracted load.
FreightWaves SONAR monitors rejection rates (0-100%) as a way to monitor market conditions in the truckload market. This rate measures the percent of contracted loads that are rejected by carriers.
Because truckload is a commodity, a declining rejection rate suggests that carriers are losing pricing power, while an increasing rate suggests carriers are gaining pricing power. The current
cycle’s low suggests that carriers are struggling to find high paying freight and are “taking what they can get.”
If this condition holds through the first quarter of 2023 (RFP season in freight), contract rates will face significant pressure and shippers will have the advantage.
To describe the process of how tender rejections predict rates in a market, FreightWaves created the Freight Market Waterfall Theory, which is outlined below.
Freight rates are dictated by routing guide compliance. A shipper that achieves nearly 100% of routing guide compliance will continue to optimize spending by taking advantage of lower-priced carriers. If a shipper sees compliance in its routing guide break down, it will be forced to buy capacity in the spot market, often at higher rates.
If a market is decelerating (tender rejections are falling), spot rates are likely to fall until they hit the market floor. The market floor is equivalent to the collective operating cost of carriers. At the floor state, rates are unlikely to fall below.
If a market is flat (tender rejections are near zero), in the short term there will be continued downward pressure on spot rates until rates hit the market floor.
If a flat market continues for more than a few months, contract rates are likely to fall towards the market floor.
If a market is strengthening (tender rejections are increasing), there will be upward pressure on rates. There is no ceiling on rates, but if rates stay high for an extended period of time, new capacity will enter the market.
How SONAR uses The Waterfall Theory to Create Predictive Rates
SONAR tracks routing guide compliance by tracking tender rejections and other data to determine if routing guides are likely to break down in the near future. Then, this data is compiled and compared against other data sets, including financial and operational data from hundreds of carriers, brokers and shippers.
Using data derived from hundreds of operating and financial metrics of over 200 carriers, FreightWaves calculated the average operating cost of carriers across the market. Then, this information was formulated into a “base rate” across the market – essentially the cost of operating a truck in the market. FreightWaves also developed an algorithm that multiplies the base rate against the tender rejection data to get the current market condition rate, using historical market spot rates.
The market condition rate is then trained against SONAR’s HAUL index to allow for individual market conditions. If a market has a negative HAUL value, it’s considered a backhaul market and rates can fall below the base rate. A market with a positive HAUL value is considered a headhaul market.
Keep in mind that the rate for any given lane is determined by both the origin and destination; the cost to move a truckload has as much to do with the attractiveness of a certain destination market as it does with the availability of trucks in a given origin market.
Adjusting the base rate by conditions in those markets gives the FreightWaves data scientists a model of “today’s rate” by origin/destination pair.
Today’s rate is then forecasted out a year by looking at the historical rates and future direction of the market, using SONAR data from thousands of sources. The rates automatically adjust for seasonality variations in the model and other financial and operational components.
The model also becomes smarter over time as more data is fed into it. Significantly, FreightWaves models for each market interact with each other, so a surge in volume in Atlanta, for example, will affect how we think about the availability of capacity out of Macon.
The Freight Market Waterfall Theory demonstrates why load board-driven freight data is heavily skewed and you see extreme flips in the load to truck ratios that are not truly representative of market conditions. In order to truly understand market activity, you should look at actual loads that have been tendered and avoid using load board data only.
To learn more about how FreightWaves SONAR can help you navigate volatility and improve your bottom line, click here.