Retailers, manufacturers and suppliers have saved a lot of money on transportation costs in 2023 compared to the years before, but other parts of their organizations are facing persistent inflationary pressures on everything from energy and labor to cattle futures and the cost of money itself. Margins remain challenged in many industries, and strategic finance teams are scouring their companies’ profit and loss statements looking for opportunities to trim costs.
Even after the long series of contract rate cuts that began in July 2022, transportation managers and supply chain leaders still have a cost-reduction role to play in 2023. The best part is that most shippers are in a position to cut spend without sacrificing the high service levels they’ve finally been able to restore.
Most firms are still paying too much to contracted carriers and underutilizing much cheaper spot rates on many lanes. The reason they’re doing this is that they lack granular market data on contract and spot rates and prevailing service levels. Shippers don’t actually know if they’re paying too much for the service they’re getting relative to their competitive peers.
In fact, there’s evidence that the majority of U.S. shippers are still paying too much on their awarded freight contracts. Let’s look at some data.
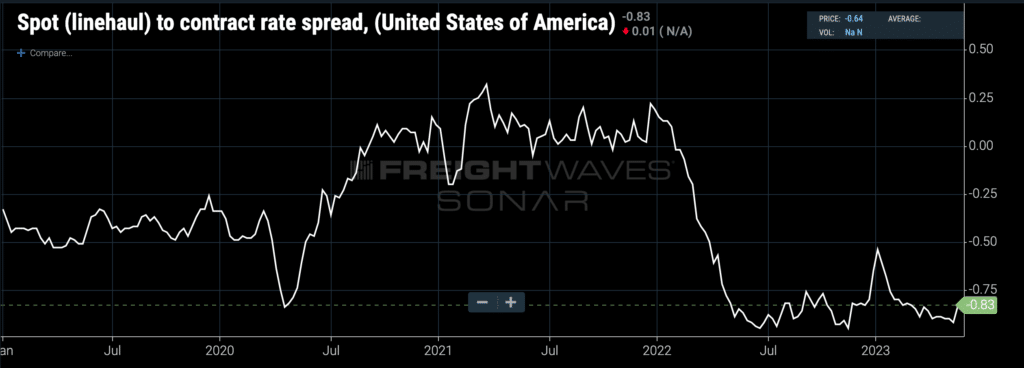
(National average spread between spot and contract linehaul rates in USD per mile. Chart: FreightWaves SONAR. To learn more about FreightWaves SONAR, click here).
The chart above shows the national average spread between spot and contract truckload rates, excluding fuel. The current spread of negative 83 cents means that spot rates are 83 cents per mile lower than contract rates. That’s a deeply negative spread: In all of 2019 and most of 2020, spot rates were only 25 to 50 cents per mile below contract rates. A spread of negative 83 cents per mile implies that contract rates could come down further without impacting service levels, because contracted carriers would be unlikely to find higher-paying loads on the spot market.
Of course, truckload rates aren’t priced according to national averages — details like the origin and destination, time of year, time of week, weight, and unloading procedures all factor in how freight gets priced. Unforeseen externalities like weather events, infrastructure issues or congestion in other modes can suddenly emerge to have an impact on rates and service. That complex set of contingencies makes it impossible to optimize a truckload network based on benchmarks, rules of thumbs or national averages.
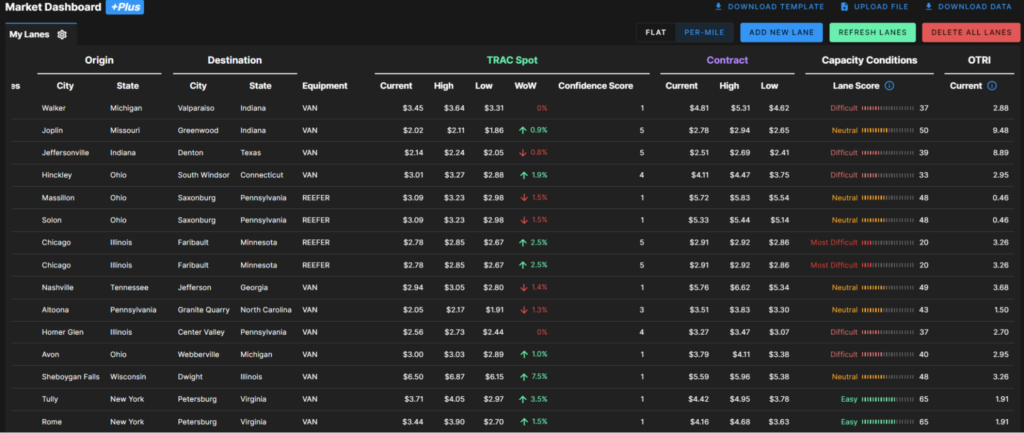
Being able to automatically compare multiple rate, capacity and service trends on a lane-by-lane basis would enable shippers to fine-tune their RFPs and bid processes to bring down costs in only the lanes where they’re paying too much, so that they don’t increase the risk of service failures. That’s exactly what SONAR Supply Chain Intelligence (SCI) does: granular analysis of opportunities and risks in complex truckload transportation networks based on lane-by-lane transaction data.
Broad-based freight market data suggests that there’s still a substantial cost-reduction opportunity in front of supply chain leaders. A 40-cent-per-mile reduction in truckload contract rates would put the spread back at negative 43 cents per mile, which is squarely in the historical range but not aggressively narrow. In other words, there would still be a comfortable spread and little danger of spot rates exceeding contract rates. Because the current national average contract rate is $2.41 per mile, a 40-cent-per-mile reduction would represent a 16.5% reduction in freight spend. That’s a significant savings that the average shipper should be able to realize without affecting the shipper’s tender acceptance rates.
That’s not the only way that supply chain leaders can become their CFOs’ heroes in 2023. Medium-term demand planning is a thorny problem for strategic planners due to a lack of timely data and organizational responsiveness.
Many big-box retailers — not to mention industrial manufacturers and suppliers — that focus on their own historical freight data fail to connect trends in their freight spend to broader economic activity. Shippers reviewing their own contract freight receipts, which are only available after a lag of 60 days or more, are out of step with the spot market and broader volume pressure on trucking. That lag has consequences: It means that shippers don’t see freight market dynamics as they unfold in real time, and they lack fast, reliable signals of consumer spending and economic activity. Purchase orders are then made on the basis of an aging view of the economy, causing shippers to overreact to temporary blips and underreact to slowly but steadily developing trends.
By connecting demand planning, purchase ordering, inventory replenishment and budgeting to the fastest available freight data based on transactions less than 24 hours old — before the shipments have even moved — all relevant parts of a shipper’s organization get a real-time view into the goods economy. Disparate business units gain a common source of truth, making it easier for executive teams to build conviction for strategic shifts or pivots. Supply chain leaders can modulate freight flows upstream and downstream, from procurement to distribution, in response to the latest volume trends from the consumption side of the economy.
Immediate freight cost reductions of 16.5% or more are the low-hanging fruit in today’s freight market for strategic finance teams at shippers. But there’s a longer play, too — one that involves accelerating the flow of information through the entire supply chain organization to optimize demand planning, inventory and sales. Say goodbye to expensive inventory overhangs. Say goodbye to lost sales due to stockouts.
To learn more about how FreightWaves SONAR can save your organization money and enrich your strategic planning, click here.