FreightWaves SONAR Outbound Tender Rejection Index (OTRI)
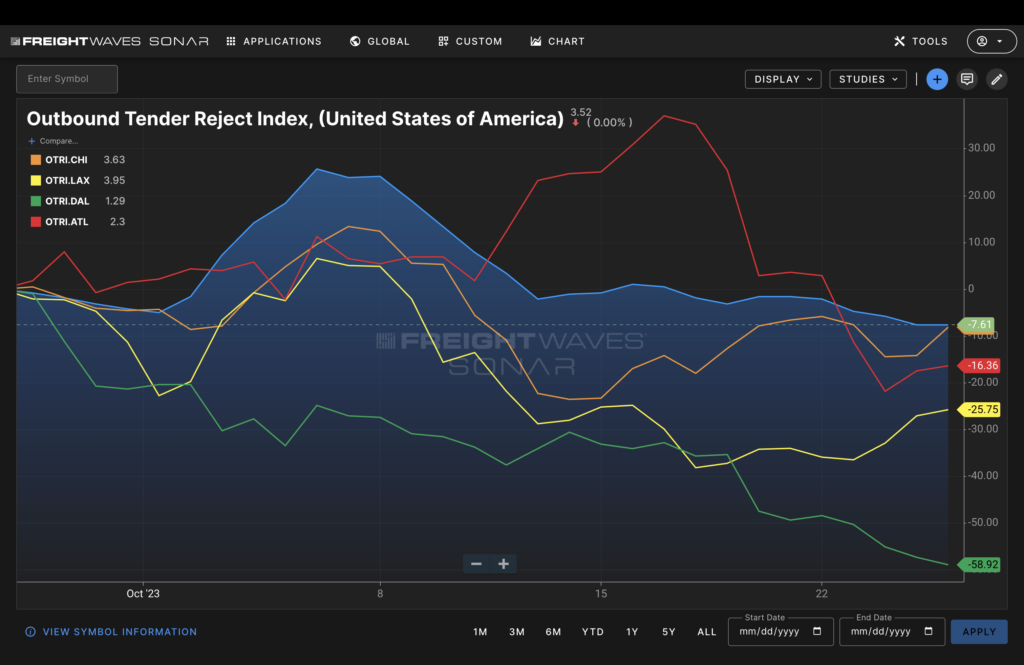
FreightWaves SONAR Outbound Tender Rejection Index (OTRI) is an anonymized measurement of mid-sized to large truckload carriers’ willingness to accept the loads that are offered (or tendered) by shippers. OTRI is an indicator of capacity availability in contracted surface freight markets. It is expressed as a percentage of loads of rejected freight to total loads tendered. This index provides data at the national, regional, state and market level. Motor carriers reject load requests for two reasons: As demand for freight hauling services exceeds supply, load requests are rejected; and if the price of a tendered load is considered too low, it is rejected.
Shippers, freight brokers, fleet managers, transportation executives, owner-operators, economists, financial analysts, investors and bankers rely on this data. This index allows supply chain teams to visualize freight movement patterns, volatility and price movements.
OTRI allows carriers to identify potentially disruptive events in the freight market. When OTRI increases, it may be more difficult to source capacity. When it decreases, capacity may be more readily available in a given area.
Market volatility leads to higher margins for brokers. OTRI helps brokers target markets that have more difficulty sourcing capacity.
Current trends in OTRI help shippers know when there is a potential for service disruptions.
What does OTRI tell a user?
OTRI denotes supply and demand dynamics in freight and logistics.
High rejection rates indicate high demand relative to trucking capacity.
Low rates of rejected freight indicate low demand relative to trucking capacity.
When OTRI is high due to insufficient truckload capacity to meet demand, outbound rates tend to increase.
FreightWaves SONAR OTRI data details
Covers the lower 48 states and includes limited Canada data
Representative of more than $200 billion in annual spend on freight hauling services