Freight analytics charts are the most powerful feature leveraged in SONAR. They’re not only the easiest way to see how freight data tracks over time – they provide a comprehensive set of tools for in-depth analytics, trending and detailed reporting. The 3D view of data presented in our freight analytics charts allows you to analyze, compare and monitor SONAR’s more than 300,000 daily freight indices.
Freight Analytics Charts
Chart any of the 300,000 daily freight indexes using the assigned ticker for that index.
Common language search allows for quick identification of appropriate data indexes.
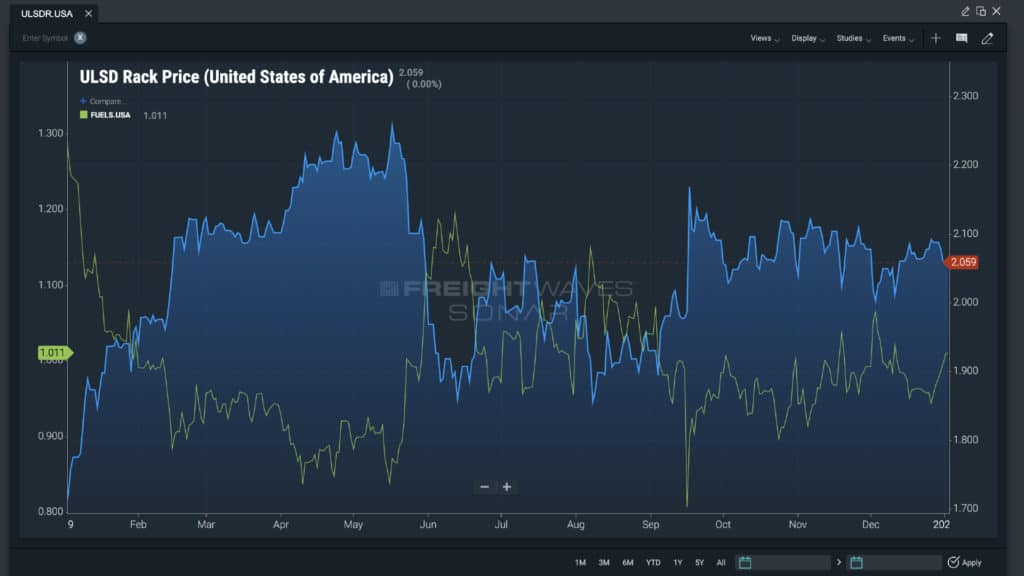
Compare multiple indexes using tickers on the same chart.
Comparisons can be done in absolute, relative and dual axis, crucial when it comes to comparing two different types of data series.
Easily compare year-over-year activity by plotting in a seasonality chart that demonstrates how the index has tracked in current and previous years.
Launch the charting function from other features, including Market Tables and Maps for deeper analysis and trending over time.
There are 8 different chart styles to make the data easy to study: candle, bar, colored bar, line, hallowed candle, mountain, baseline and volume candle.
Chart preferences can also be customized:
Log scale
Invert Y-axis
Range selector
Large fonts, custom colors and backgrounds
Show units in Y-axis
Chart views can be saved for future reference or quickly shared between users.
Events, such as news (covered by FreightWaves), holidays or seasonal impacts to the freight calendar can be annotated to the chart.
Users have the ability to mark up the charts with a vast toolkit for making notes or by calling out significant events or trends found in the data.
Charts are equipped with 10 different types of studies, helping the user quickly identify changes in the data: