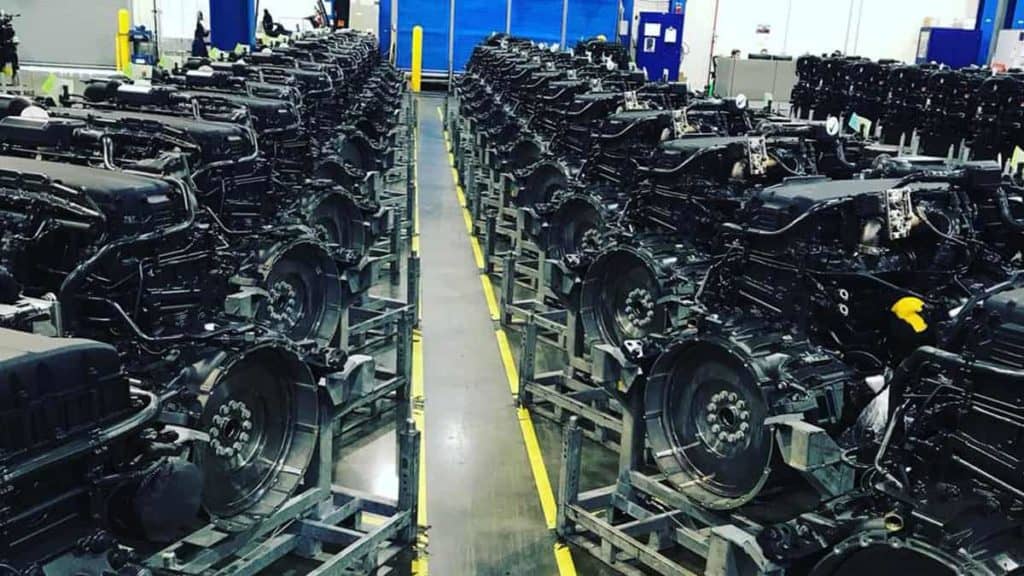
Trucking rates are partly driven by capacity, which is very sensitive to small changes in supply and demand. If you want to understand capacity, it makes sense to follow new truck orders and new truck builds.
New class 8 truck orders tend to correlate well with the trucking cycle. As the trucking industry heats up, carriers begin to expand and order new trucks to take advantage of the attractive fundamental backdrop. New seated drivers also enter the industry from other industries because the pay from driving a truck becomes relatively more attractive.
As volumes and rates fall begin to fall as too much capacity enters the market, new truck orders tend to fall sharply. This is exactly what happens when there is a freight recession. Based on the last three freight recessions (2016, 2019 and the first half of 2020), it is commonplace for new truck orders to fall more than 50% year-over-year for several months on end when conditions in the trucking industry are unfavorable. However, lean years like 2016 and 2019 when new orders run well below replacement demand allow the market to be cleansed of excess capacity, which sets the industry up for the next upcycle.
At FreightWaves, we estimate total replacement demand to be 275,000 trucks (about 23,000 per month) based on there being roughly 2.3 million total trucks in market in the U.S. (1.6 million total for-hire and 700,000 private fleet tractors) and a 12 percent replacement rate (roughly every eight years).
We believe that the 12% replacement rate estimate is very conservative as most large fleets replace their tractors every three or four years. Trucks must be replaced fairly often because if the average driver puts 2,400 miles a week on his tractor (or about 125,000 miles annually), a four year replacement cycle implies a new tractor can go about 500,000 miles before it must be replaced. Going too far beyond that point makes little economic sense for carriers because repair and maintenance costs tend to rise dramatically and this problem is exacerbated by foregone revenue on parked tractors under maintenance. It is true that many owner operators will enter the trucking market by buying a three, four or five year old used truck because a used truck tends to run about half the price (or less) of a new truck. But in general, running a truck for more than 8 years is not practical and difficult to do profitably.
Using an example of an extremely difficult year for new class 8 truck orders, in 2019 new truck orders were 180,995. This level of new truck orders was not only down 63% year-over-year (compared to 2018’s record 490,129), but was 94,005 trucks short of our 275,000 replacement demand estimate. Relative to the total 2.3 million trucks in the U.S., this shortfall is theoretically equivalent to about 4% of trucks exiting the market. 4% of capacity exiting the market is a very large amount in light of an industry where small changes in supply can really move the needle on rates.
Moreover, due to COVID-19 causing uncertainty and low visibility for carriers and therefore extremely weak demand for new trucks given the deepest recession since the Great Depression, the outlook for a coming capacity crunch has been magnified once demand normalizes and actually begins to turn back up as the economy expands again (which we think is already starting to occur as of June 2020).
Finally, it is also important to watch other metrics such as new truck builds and dealer inventories for further clues on capacity. If the economy strengthens from a position of weakness, then low class 8 new truck builds should help correct for overcapacity in fairly short order (in about a year or so). And given there is generally a nine to 12 month lead time for a new truck, booming trucking markets can persist for several quarters before mean reverting.
For example, new truck builds are important because if new tractors built are less than replacement tractors required, then there is a deficit of new trucks and rates are likely to eventually firm in the future. This is the case in 2020 as ACT Research (the leading authority on Class 8 trucks) projects just 152,000 retail sales of Class 8 trucks in North America in 2020 (45% below replacement demand and down 16% year-over-year from an already extremely depressed 2019) and the production of only about 117,000 trucks.
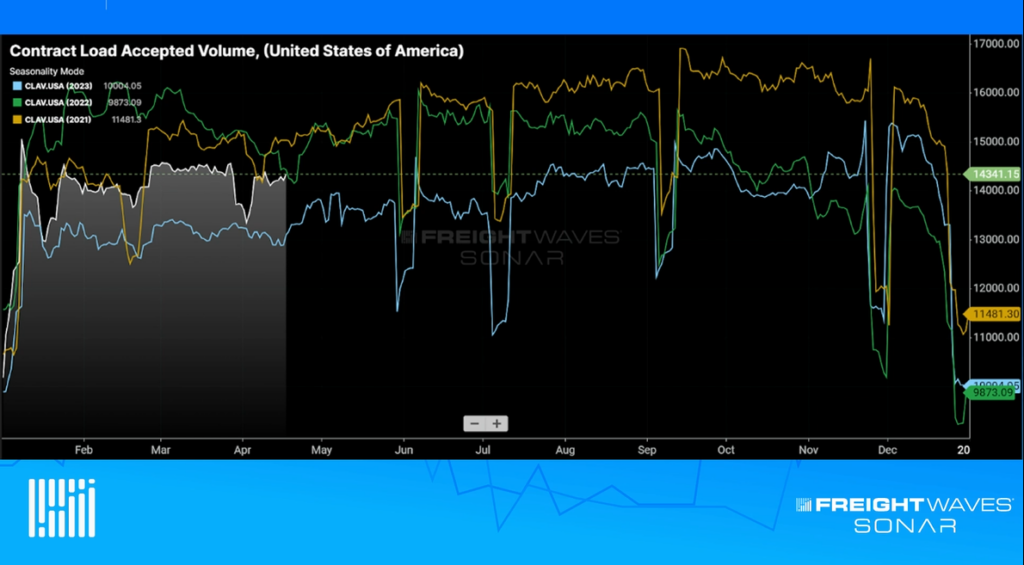
If you are interested in tracking the freight market, including contract and spot rates, FreightWaves SONAR offers over 150,000 indices, most of which are updated daily. The world’s fastest, most accurate freight data includes trucking spot rate indices, tender indices, and market balance indices. SONAR freight tender indices are created based on actual electronic load requests from shippers to carriers, meaning you know that the index is measuring an actual load transaction.
SONAR offers proprietary data that comes from actual load tenders, class 8 trucking data, electronic logging devices and transportation management systems, along with dozens of third-party global freight and logistics-related index providers like TCA Benchmarking, Freightos, ACT, Drewry and DTN.
SONAR offers the fastest freight market data in the world, across all major modes of traffic. The SONAR platform is the only freight forecasting and analytics platform that offers real-time freight market intelligence driven off actual freight contract tenders. Find out more about FreightWaves SONAR.


